Uber is best-known as a ride-hailing company, the first of its kind in the new generation of gig-economy.
As the company grows, Uber has expanded into other areas, including UberEats.
Ride-hailing, in some way, is delivering people. UberEats, similarly, is delivering food.
Contrast to previous giants that create delivery systems with their own capital & employees, Uber is marching into this playground by facilitating the supply and demand, whether it’s people, food or other things.
During the current coronavirus pandemic, it has become more clear that moving people around is not the fundamental mandate of Uber; but matching the supply and demand is.
Consumers are increasingly using food delivery, grocery delivery and other tools to remain at home. No-contact delivery options have become popular.
As of the beginning of 2018, Amazon’s freight shipping arm has shipped over 5,300 shipping containers from China to the United States. Amazon provides either simply the trans-Pacific portion of the trip or end-to-end service for companies that want it. That can include pick-up at the factory door in China, shipment across the Pacific to a U.S. port, and trucking to Amazon fulfillment centers in the United States. Amazon Logistics and Beijing Joyo have published rates in their publicly accessible tariffs that describe the types of services and fees that their clients can utilize.
Amazon embarked in earnest on building its own last-mile network after UPS failed to bring orders to customers in time for Christmas in 2013, costing Amazon millions of dollars in refunds. [WSJ]
In 2018, Amazon ordered 20,000 Mercedes-Benz vans from Daimler. Since developing its own delivery network in 2018, Amazon .has built up a fleet of 30,000 last-mile delivery trucks and vans. As of Dec 2019 Bloomberg’s report, it has more than 800 delivery contractors in its last-mile network employing 75,000 U.S. drivers.
Amazon also has announced plans to order 100,000 battery-powered delivery vans from Rivian Automotive, an electric car-making venture it purchased a stake in earlier this year. The first of those battery-powered vans will hit the road in 2021.
Prime Air, the Amazon-branded planes, first debuted in Aug 2016. It first plane is a Boeing 767 owned by Atlas Air that had been converted into a freighter. Amazon announced deals with two aircraft leasing companies — Atlas, and another called Air Transport Services Group, or ATSG — in May 2016 to fly as many as 40 dedicated cargo planes over the next two years. [recode]
Atlas Air will be phasing in 20 Boeing 767-300s to carry Amazon’s freight, under the terms of a 10-year lease and a seven-year maintenance and operation contract. ATSG says its air services will eventually operate just as many planes for Amazon: 12 Boeing 767-200s that are covered by five-year leases, plus eight 767-300s with seven-year leases. [geekwire]
Source: recode
In May 2019, the main Air Hub at the Cincinnati/Northern Kentucky International Airport broke ground. Amazon will invest $1.5 billion. It can park 100 cargo jets and will open in 2021.
“These new aircraft create additional capacity for Amazon Air, building on the investment in our Prime Free One-Day program,” said Dave Clark, Senior Vice President of Worldwide Operations at Amazon. “By 2021, Amazon Air will have a portfolio of 70 aircraft flying in our dedicated air network.”
Amazon has been steadily growing its logistics operation over the last decade, and it now delivers more than half of all Amazon packages in the US. “Our AlphaWise analysis shows that Amazon Logistics already delivers ~50% of Amazon US volumes, focused on urban areas,” Morgan Stanley said.
Share of Amazon Packages | Source: WSJ
Amazon needs to deliver about 5 billion packages per year. Amazon Logistics delivers about 20% of its U.S. package volumes from a year ago and is now shipping at a rate of 2.5 billion per year.
MS estimates UPS and FedEx have U.S. shipping volumes of 4.7 billion and 3 billion packages per year, respectively.
By 2022, Amazon Logistics will reach a volume of 6.5 billion packages per year , far exceeding its estimate for UPS at 5 billion packages per year and FedEx at 3.4 billion packages per year.
FedEx and UPS
In its 2018 annual report, published in Feb 2019, Amazon counted companies in “transportation and logistics services” among its rivals. “They had never done that before that day,” Mr. Smith (Founder, Chairman & CEO of FedEx) said. “So we took it seriously.”
While FedEx is walking away from the largest e-commerce player in the U.S., FedEx is positioning itself as a go-to carrier for Target Corp., Walmart Inc. and the world of retailers that aim to compete with Amazon. [WSJ]
Meanwhile, UPS has been investing heavily to expand its capacity to handle more packages for Amazon and other shippers. UPS reported a surge in the volume of packages going through its air network in the June quarter. [WSJ]
Further, in the 2019 holiday season, Amazon blocked its third-party sellers from using FedEx’s ground delivery network for Prime shipments, citing a decline in performance heading into the final stretch of the holiday shopping season.
While railway and steamship are useful in long distance delivery, short distance and city delivery system was still relying on manpower and horsepower. Things started to change in the 20th century.
In December 1899, an automobile mail wagon was tested in the US for the first time. Officials cheered the dramatic increase in collection speed and soon postmasters across the country were testing motorized vehicles. Collection times were cut at least in half in most trials. [PostalMuseum]
Driving was not an everyday skill in the early 20th century, so the Post Office asked manufacturers and suppliers to provide drivers along with the vehicles.
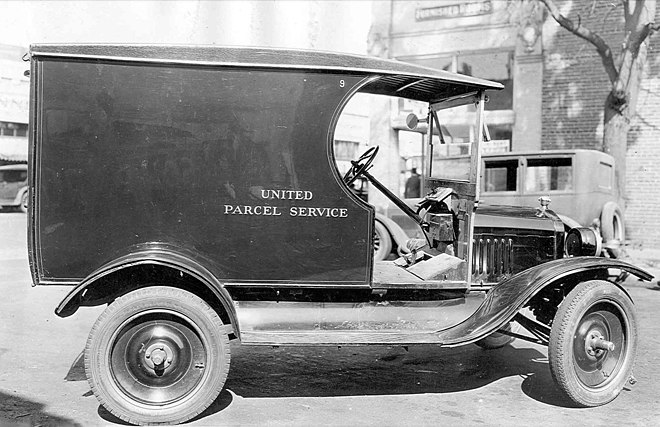
UPS bought its first car, a 1913 Model T Ford, and attached a truck bed to its back. By 1915, it was using four autos and five motorcycles, and employing 20 foot messengers.
Ford Model T UPS delivery vehicle in 1921 | Source: Wikipedia
In 1919, it started to use the current name UPS.
After WWII
During the Great Depression of the 1930s and America’s involvement in World War II from 1941–1945, new truck purchases were a low priority at the Post Office Department. As a result, trucks bought in the 1920s and early 1930s were kept on the road longer than expected. [PostalMuseum]
Fueled by the boom of the auto industry, industrialization again revolutionized the delivery system and further expanded the ability of settlement in less connected lands across the US.
Post war, the family car played a central role in suburban life; the number of cars on the road increased from 25.8 million in 1945 to 61.7 million by 1960. America’s growing dependence on automobiles and the growth of the suburbs pushed the Post Office Department to change how it transported and delivered mail. Passenger trains — which had transported most mail since the 19th century — declined, as more and more people chose the open road over the railroad. [USPS]
The first Highway Post Office bus was inaugurated on February 10, 1941. A second route was not established until 1946 due to the outbreak of World War II.
Highway Post Office Bus | Source: postalmuseum
Highway Post Office routes were organized on round trips which averaged about 150 miles each way. There was a very good reason for this, as the bus generally could only hold enough gas for about one 150 mile trip, and fuel stops meant losing valuable time.
Three-wheeled vehicles like Mailster were tested in half a dozen cities beginning in June 1950. By the end of the decade, more than 5,700 Mailsters were in service; the number peaked in 1966, at about 17,700 nationwide.
Postal system has its political importance, which is why it’s included in the constitution. As the US expanded, how information / news / mails were transmitted were directly influencing the limit of a united society.
On July 7, 1838, Congress declared all railroads to be post roads and enabled the railways to make contracts as long as sending mail by rail cost no more than 25 percent above transporting it by stagecoach.
But it’s the industrialization that enabled the US to include / connect California and other lands that are far away from the initial states.
In 1848, US acquired California at the end of the Mexican War. Under the Treaty of Guadalupe Hidalgo, Mexico also recognized the U.S. annexation of Texas, and agreed to sell California and the rest of its territory north of the Rio Grande for $15 million plus the assumption of certain damages claims.
In November 1848, Postmaster General Cave Johnson dispatched a special agent to California to establish Post Offices. By Christmas, steamships were carrying mail from New York to California via the Isthmus of Panama. This was before the construction of the canal. When the ships reached Panama, the mail was taken off and transported in canoes or on pack animals – and later by railroad – about 50 miles to the Pacific coast. Another steamship collected the mail on the Pacific side and headed north.
The first U.S. Mail traveled to California by steamship, via the Isthmus of Panama, in 1848 | Source: USPS
Congress authorized funding for the overland routes not because they brought any financial profit to the Post Office Department or the federal government, but because they helped build and bind together a nation.
Also briefly mentioned in 一朝风雨一代王:Sears, Walmart, Amazon, the expansion of the US rail transportation contributed to the growth of USPS (Post Office Department at the time).
Source: gorhistory.comSource: gorhistory.com
In 1862, mail was sorted en route, as a train moved between two points, using converted baggage cars.
By the early 1900s, railroads were critical to postal operations. Like Union Station in Washington, D.C., located adjacent to the City Post Office Building, the Post Office Department ordered that all new main post offices in large cities be built as near as possible to the principal railroad station.
When the current coronavirus (COVID-19) hit the world and people prepare to stay at home for weeks, some of the social infrastructures are receiving increased attention.
The delivery system is a very good one to start. As uber not only provides uberEATS but also grocery delivery, Walmart / Target / CVS increasingly focus on delivery, etc., I will try to review the development of US delivery system recently and what is implied for the future.
Pre-industrialization: The Origin And Natural Power
The origin of United States Postal Service (USPS) can be dated back to 1775 when Benjamin Franklin was promoted as the first postmaster general.
In 1778, the US Constitution, Article I, Section Eight, known as the Postal Clause, says “The Congress shall have Power to establish Post Offices and post Roads”. This explains the importance of the postal system and its position as a government branch nowadays.
In the early days, mails were mainly carried by manpower and horsepower. In 1785, the Continental Congress authorized the Postmaster General to award mail transportation contracts to stagecoach operators, in effect subsidizing public travel and commerce with postal funds. Despite their higher costs and sometimes lower efficiency, stagecoach proposals were preferred over horseback.
The Philadelphia Stage Coach (about 1800) | Source: https://peterpappas.com
… expanded the scope of JumiaPay beyond our physical goods marketplace. As of December 31, 2018, JumiaPay was only available within our physical goods marketplace. It is now also available within our on-demand services, Jumia Food, and hotel booking portals, Jumia Travel, in selected countries.
…we continued to expand the range of financial and digital services available from third parties, powered by JumiaPay, offering our consumers an increasing range of relevant every day services.
In Nigeria for instance, consumers can now access micro-loans offered
by a local fintech startup, alongside event tickets offered by a local event ticketing provider.
In Egypt, in the second quarter of 2019, we started distributing services from a local deals provider allowing consumers to purchase their vouchers on the Jumia platform, using JumiaPay.
Not surprisingly, 2019 has been a good year for JumiaPay, with quarterly TPV ( Total Payment Volume) growing constantly and annual TPV of ~€124 million.
TPV as a percentage of Jumia’s GMV, grew from 8.6% in 19Q1 to 15.1% in 19Q4. (update: GMV before adjustment)
Meanwhile, the value per transaction on JumiaPay is lower than its value per order on Jumia, which makes sense as JumiaPay is more user in every day purchases.
In 19Q4, €19 per transaction is roughly half of the Jumia order value (€36).
JumiaPay provides a hyper-growth opportunity.
In the Q4 press release, it says “the ramp-up of JumiaPay on-platform is attributable to our continuous education efforts of consumers, the expanding range of digital services offered as part of our JumiaPay app as well as a number of newly introduced marketing initiatives. These include Mastercard Tuesdays discounts, cash-backs funded by card issuing banks or the possibility to pay for purchases in 12-month installments at no interest, offered by partner banks. “
Below is the chart for Jumia’s performance in terms of GMV.
A spike in 2018Q4 just before IPO is controversial..
Although with the “artificial” growth in 18Q4, the trend looks good
The more worrying part is the slowdown in GMV growth – especially when Jumia is still has a long way to go
Jumia’s full year 2019 GMV is €1.1 billion, up 33% compared to 2018.
Comparatively, Pinduoduo’s GMV in the twelve-month period ended December 31, 2018 was RMB471.6 billion (US$268.6 billion), an increase of 234% from RMB141.2 billion in the twelve-month period ended December 31, 2017.
Combined with Jumia’s annual active customer base, we can see the GMV per AAC declining over time.
In its Q4 press release, Jumia says “we have reduced promotional intensity and consumer incentives on lower consumer lifetime value business. While most product categories experienced GMV growth in the 20 to 50% range, phones and consumer electronics contracted by approximately 20% on a year-over-year basis. This aspect of the business mix rebalancing will likely continue to negatively impact GMV development over the next two quarters.”
Source: Jumia 2019Q4 Presentation
“…we have increased our focus on everyday product categories such as Fast Moving Consumer Goods (“FMCG”), fashion, beauty and personal care as well as digital services which provide affordable entry points into the Jumia ecosystem…”
We could also see that Pinduoduo’s GMV per active buyer is a little bit insane..
approx. annual GMV per active buyer = $268.6 billion / 418.5 million = $641.8
Jumia is at ~€180 in 2019, using annual GMV divided by ending AAC.
To compare it with consumers’ e-commerce purchase across the globe..
Jumia was offering 13,500,000 ADR shares with an IPO range of $13 to $16 per share and priced at $14.5 per share.
Mastercard Europe SA has agreed to purchase €50.0 million of shares in a concurrent private placement at the same price.
As of December 31, 2018, Mobile Telephone Networks Holdings (Pty) Ltd (“MTN”), Rocket Internet SE (“Rocket”) and Millicom International Cellular SA (“Millicom”) own respectively 31.28%, 21.74% and 10.15% of the Company.
Other shareholders are AEH New Africa eCommerce I GmbH (8.86%), AXA Africa Holding SAS (6.06%), Atlas Countries Support S.A. (6.06%), Chelsea Wharf Holdings S.à r.l. (5.51%), CDC Group (4.04%), Rocket Investment Funds (3.48%) and Goldman Sachs (2.83%).
Africa has one of the most digitally connected populations on the planet, with 400 million internet users.
Comparatively, say China has three times the number of internet users (1.2bn), Jumia would have 12 million or 18.3 million respectively.
Pinduoduo, a relatively new e-commerce platform in China, said its Active buyers in the twelve-month period ended December 31, 2018 were 418.5 million, an increase of 71% from 244.8 million in the twelve-month period ended December 31, 2017.
We are talking about totally different stages of e-commerce. Low penetration means more education and infrastructure are needed while potential upside is large.
In the future where Fintech firms dominate, established companies are reacting with three main strategies:
Cut costs for legacy business lines – like what we said in a previous post Banking Headcount Cut
Consolidate with other legacy companies to gain more market share and thus more say/power, further cutting expenses and trying to get more economy of scale – like what we said in the last post From TD Ameritrade To E-Trade: A Wave Of Consolidation
Acquire Fintech startups or replicate what they are doing – like the title of this post Buy & Be FinTech
Plaid is a Fintech firm that enables a lot of other Fintech apps & digital transaction based businesses, providing underlying APIs. It counts Venmo, Robinhood, Coinbase, Acorns, etc. as customers.
Credit Karma lets people check their credit scores, shop for credit cards and loans, file taxes and more. It had close to nearly $1 billion revenue in 2019, growing at 20%.
The company started out originally in 2007 providing free credit scores, later extending that to full credit reports. Credit Karma’s launch of a financial planning tool in 2013 drew a direct comparison to Intuit’s Mint. And since then, Credit Karma has launched other products that directly rival Intuit, for example a free tool to help people file their taxes. These not only represented direct competition, but a disruptive threat, since Credit Karma’s products skewed younger and were built on a “free” premise (offering the products at no charge and instead making money off showing users and selling relevant, related products). The fact that Credit Karma partners with so many other financial services providers also means it’s sitting on a huge data trove that it leverages to build and personalize products, representing a data science angle for Intuit here, too. [TechCrunch]
Meanwhile, besides the notable acquisitions of Fintechs, companies are building similar services by themselves.
By mimicking the experiences/apps offered by startups, established players are essentially becoming Fintechs themselves, thus evolving internally and embracing the future more positively.