Social network platforms such as Twitter and Weibo, are where we post our words/expressions, and is taking an essential role in todays’ Modern Communication.
Interestingly, but not surprisingly, they are also providing a feedback loop to change our ways of communication (and our thinking – but that’s another different story). After all, we are one of those animals with natural herding inclinations.
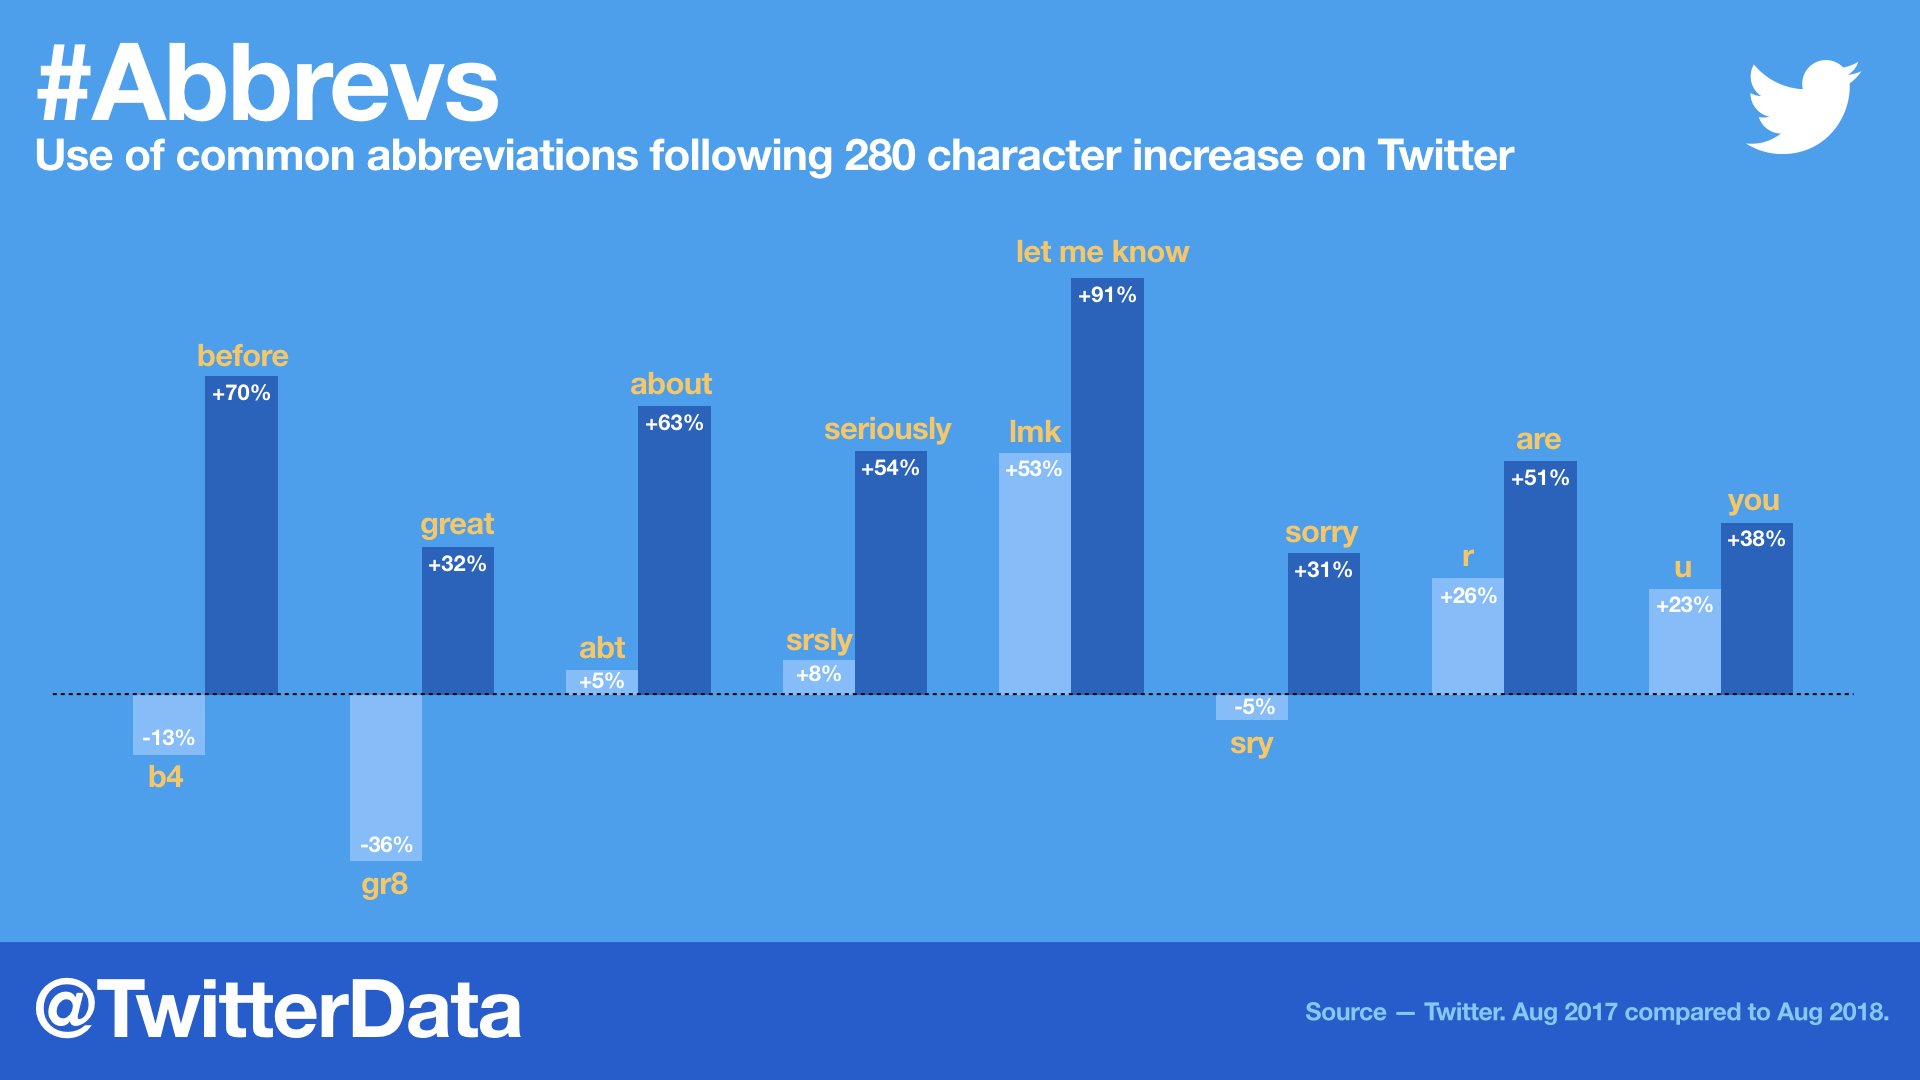
Taking a very simple example – as Twitter was becoming more popular, people started to lean heavily towards the use of new abbreviations, partially due to its 140-word limit. (Similarly, when Blackberries were popular, certain abbreviations were created, used and spread among professionals in texts & emails)
In 2017, Twitter officially made its “140-word limit” a history [Weibo ended the limit in 2016] and doubled the character limit to 280. One resulting impact is that people are spelling out abbreviations and acronyms more often, according to Twitter’s report.
Source: TwitterData
TwitterData also touted that “people are saying ‘please’ (+54%) and ‘thank you’ (+22%) more.” in the first year of doubling limit.
[Something worth noting on the data – 1) need to consider the difference in total number of tweets 2) need to consider other ways of saying ‘please’ and ‘thank you’…]
It is really nice that people could be more friendly and polite (not excessively tho). It would be even nicer if people could inherit their concise and efficient use of language in the 140-word era & all the other positive impacts Modern Communication made on us.
Today Apple announced new products of three lines of business – MacBook Air, iPad Pro and Mac mini.
MacBook Air 2018 Gold | Source: AppleiPad Pro 2018 11-inch and 12.9-inch | Source: AppleMac mini 2018 | Source: Apple
Besides the new features and superior performance, Apple seems to be more addicted to aggressive price tags. Today’s event is the latest episode of a series, starting from the 10-year anniversary model iPhone X last year.
[discussion below is based on the most basic consumer version of each product]
9/12/2017 – iPhone X introduced @ $999, a 30% increase from the high-end phone (iPhone 7 Plus @ $769) one year before
5/27/2018 – updated iPad introduced @ $329, flat with the new iPad debut price in Apr. 2017.
7/12/2018 – updated MacBook Pro @ $1,799; the price seems to be the same as Oct. 2016’s debut price with Touch Bar, but is a 20% increase in terms of available low-end option (MacBook Pro with no Touch Bar @ $1,499).
9/12/2018 – iPhone XR @ $749, increased by 7% ($50) compared to the low-end phone last year (iPhone 8 @$699) ; Apple Watch Series 4 @ $399, increased by 21% ($70) from a year ago @ $329.
10/30/2018 – new MacBook Air @ $1,199, a 20% increase from the old model years ago @ $999; updated iPad Pro @ $799, a 23% ($150) increase from previous Jun. 2017 version @ $649; new Mac mini @ $799, a 60% increase from the old model years ago @ $499; redesigned Apple Pencil 2 @ $129, increased by 30% from $99 when it was introduced 3 years ago
The 2-way strategy looks clear: 1. use entry-level new products (e.g. iPad & iPhone XR) to attract new users and compete with other firm’s often lower-priced products. Educational market and some international markets are important here, especially for new-user growth, ensuring an increasing number of total active users in Apple’s ecosystem and getting more market shares in terms of shipment. So there is barely any increase in price. 2. raise prices by 20-30% in other product lines to keep margin (for example Apple Watch price increase might be more associated with costs) or to compensate lower margins in entry-level products.
Apple’s overall average gross margin from 2016 to present is actually lower than the average from 2014 to 2015 (38.44% vs. 39.63%, down ~120bp), even with higher gross margins from service revenues weighing in more recently.
Coincidentally, a few incidences involving people’s death/missing happened during the last weekend and became headlines around the world.
In the US, massive shoot developed in a Pittsburgh synagogue, leading to at least 11 deaths.
In Chongqing, China, a bus ran off a bridge into deep water of Yangtze River with an estimate of 15 on board.
In Indonesia, a Boeing-737 MAX with Lion Air crashed into the sea after took off with 189 people on the plane and 0 survivor has been found so far.
[May those taken from us rest in peace]
While there are different reasons (or direct causes) behind these tragedies, they all reminded us of how vulnerable our species is. Technology and society advancements have their own ways of going wrong.
Our ancestors don’t have much direct advantages to survive their world; yet we have conquered and shaped our planet to an ever increasing degree over our history. We can protect ourselves from stronger animals which would otherwise make us their food; we can fight destructive fires which would otherwise burn our settlements; we can cure those deadly pandemics which would otherwise wipe out half of a continent’s population or even an entire regional population…
However, things made to combat threats could go wild and we can’t resist.
The tools we created and the capabilities we built into them dwarf our physical/natural abilities. We are not very much improved genetically as a species over the last 1 million years (and not very much different from genus Pan as genus Home).
Naturally we can’t survive a gunshot and can’t find a way out under deep water from a closed room (e.g. bus, plane).
Although life expectancy has gone from 20 to 40 to 80 and may go to 160 in the future, we are still humans.
Sometimes we just need to forget all those achievements and just be human.
Life is valuable because it is limited. May everyone of us enjoy it.
A very good educational discussion of hyperspace on World Science Festival 2010 and a brief of The Elegant Universe by Brian Greene (the book I am finishing).
Intense sub-planck undulations are seen as glimmers of distortions when zooming out, and are smoothed out on a higher level. Vice versa, seemingly flat world could be surprisingly dynamic if viewed in a sufficient close manner.
Figure 5.1 By sequentially magnifying a region of space, its ultramicroscopic properties can be probed | Source: The Elegant Universe by Brian Greene
In the investment world
Fluctuations in prices within a short time frame, however dramatic, could be (at least partially) smoothed out in a longer period of time. Vice versa, more details or clues of changes could possibly be found behind the scene even if prices stay the same in a week/month/year.
2.
What Physics says
While sub-planck variations are cancelling out with each other, some changes are constant and going in certain directions, although might be immaterial/unsensible on a daily basis – e.g. our universe is ever expanding.
In the investment world
Certain underlying trends (company, industry, economy, society, species, planet, etc.) are happening definitely in the long run. Trying to uncover those trends and making investments according to those should be an effective long term approach.
in the case of electromagnetic radiation, v is approximate 3×10⁸ m/s
In ITU standards,
Extremely high frequency (EHF) = 30 to 300 GHz in frequency = 10 to 1 mm in wavelength, so called millimeter-wave (mmW)
Ultra high frequency (UHF) = 300 MHz to 3 GHz in frequency = 1 to 0.1 m in wavelength
UHF is where our current mobile networks live on, with 4G mostly on 700 MHz, 1700-2100 MHz, 1900MHz and 2500-2700 MHz across the globe.
Under the Friis Transmission Law, higher frequency has much higher loss (attenuation) in free-space. For mmW, additional transmission losses occur when traveling through the atmosphere are absorbed by molecules of oxygen, water vapor and other gaseous atmospheric constituents.
Important absorption peaks occur at 24 GHz (for water vapor) and 60 GHz (for oxygen).
mmW attenuation | Source: T.S. Rappaport, NYU Wireless
As range of 5G signals are limited, small cells deployment, collaboration and integration will be essential. Current experiments found a 200-meter range doable.
Signal Outage (200 m Cell) in NYC using Adaptive Single Beam Antennas | Source: T.S. Rappaport, NYC Wireless
Appendix – Frequency Allocation
AT&T frequency table | Source: WikiVerizon frequency table | Source: WikiFrequency allocation in China | Source: spectrummonitoring.com
On Oct 8, Intergovernmental Panel on Climate Change (IPCC) issued a special report on the impacts of global warming of 1.5 °C above pre-industrial levels and related global greenhouse gas emission pathways. And a summary version for policymakers.
1.5°C was the target to strive for, agreed in 2015 Paris Agreement. (countries agreed to limit warming to below 2°C above preindustrial levels by 2100)
However, we are nowhere close.
Source: Climate Action Tracker
Limiting warming to 1.5°C is possible within the laws of chemistry and physics but doing so would require unprecedented changes.
– Jim Skea of Imperial College London and an IPCC co-author
By “unprecedented changes,” Skea means essentially two things. First, the world needs to start cutting emissions. Instead in 2017, the world’s emissions a new record high. Second, we need to reduce those emissions very quickly. (Quartz)
Many researches have been done to analyze the impacts of a warming of 1.5°C and above.
1. How big is today’s loss & Are we really panicking?
The market rout on 10/24 (NASDAQ Composite dropped 329.14 points to 7,108.40) made it the largest retreat so far this year, surpassing the previous 316-points loss merely 2 weeks ago (10/10).
US stock index 10/24 tumble | Source: WSJ, Dow Jones Market Data
While the 4.43% retreat is widely “touted” as the biggest one-day loss since August 2011, it’s also the 3rd largest daily point loss in NASDAQ history (the other two happened in 2000 during the dot-com bubble).
Top 10 NASDAQ Largest Point Decrease as of 10/24/2018
However, in percentage wise, we could see NASDAQ’s 10 biggest single day decrease ranging from -11.35% to -7.23% (3 of which related to the 2008 financial crisis, 3 related to the dot-com crash, another 3 related to the 1987 crash).
“-4.43%” is not a big deal & that’s not how investors react if they are really panicking.
2. All about inflation?
It’s crucial to incorporate inflation into analysis.
NASDAQ climbed above 5,000 in Mar. 2015, and it took another 7 weeks before it reached the dot-com bubble peak of 5048.61 (intra-day record was 5,132.52).
NASDAQ Composite climbed above 5,000 in Mar. 2015 | Source: Quartz, FactSet
However, when we adjust for inflation, things are different.
Doing a simple math – U.S. CPI (urban, all items ex. food & energy) is 181.3 in 2000 (annual average) and 256.5 in 2018 (H1 average); so a 8,109.69 peak in August should be around 5,732 in 2000-price-level.
So NASDAQ Composite spent more than 18 years to grow 13.5% (from peak to peak), while fundamentally technology has gone through tremendous evolutions.
CPI – urban consumers, ex. food & energy (Jan. 1999 – Sep. 2018) | Source: U.S. Bureau of Labor Statistics
Similarly, WSJ reported in January this year that “Nasdaq Tops Inflation-Adjusted High [7269.89] from Dot-Com Boom”; and the chart below shows the inflation-adjusted path.
Why did we wait for 18 years just for a come-back? So value creation has little to do with the price? Is this all about inflation in the end?
3. Sit back and relax – It’s NOT all in vain
It’s a sure thing that companies can be over- or undervalued over time. But the benefits and growths are also real.
We have (unprecedented) iPhone in 2007 and (finally) massively produced Tesla Model 3 in 2018; we have 1 TB cloud storage for $9.99/month on Dropbox/Google Drive and unlimited storage of business account for $15/month on Box or $10/month on OneDrive.
Development in biotech is equally impressive. Sequencing cost dropped from ~$100 million per genome in early 2000s to ~$1,000 in 2016; and we are curing/curbing more types of cancer with unprecedented success rate and less harmful methods. Other advancements, for example those in neuroscience or surgical robots, are no less exciting.
And we can see their reflections in stock price (e.g. AAPL TSLA ILMN ISRG).
While the NASDAQ Composite in 2000s may be overvalued, comparatively in 2018 it is more supported by concrete revenue and earnings. Promises and expectations are still built in the price, but things are a lot better.
From a similar discussion in Mar. 2015 when NASDAQ reached 5,000 again after 15 years – P/E is not even close to insane levels.
When we call it a bubble (e.g. dot-com bubble), it is usually characterized by an increasing [absurdly large] difference between price and actual value created.
Revenue or earnings can rarely be doubled consecutively between regular quarters but prices can. That’s what happened in 1999 when Nasdaq Composite rose 85.59% (vs. 28.24% in 2017) and 13 large-cap stocks rose over 1000% (vs. Amazon +56%, Netflix +55%, Facebook +53%, Apple +46%, Alphabet +33% in 2017).
While a 10-fold rise in stock price is tough to catch up by revenues and earnings, I see a 50% rise doable and reasonable (e.g. could be a combination of 80% EPS growth + 20% P/E decrease, 50% EPS growth + P/E unchanged, or 25% EPS growth + 20% P/E increase), as long as the new P/E is justified by the future prospect.
I am not saying we shouldn’t anticipate a correction; but NASDAQ Composite hasn’t been super crazy neither.
I would like to conclude this post here by saying that – I believe in the future and the real benefits of tech [if correctly used]. Some areas might seem to be more over-promised than others, and some risks are looming on the horizon [to negatively impact global economy in a nontrivial manner], but true value creation should and will always be valued.
Appendix – what does S&P look like
S&P forward P/E as of Sep. 2018 | Source: JP Morgan Asset Management